PROTOCOL: Quantifying Lipid Droplet Area with ImageJ
Purpose
To measure the area of individual lipid dropelets in images of fat tissue stained for lipid droplet membranes.
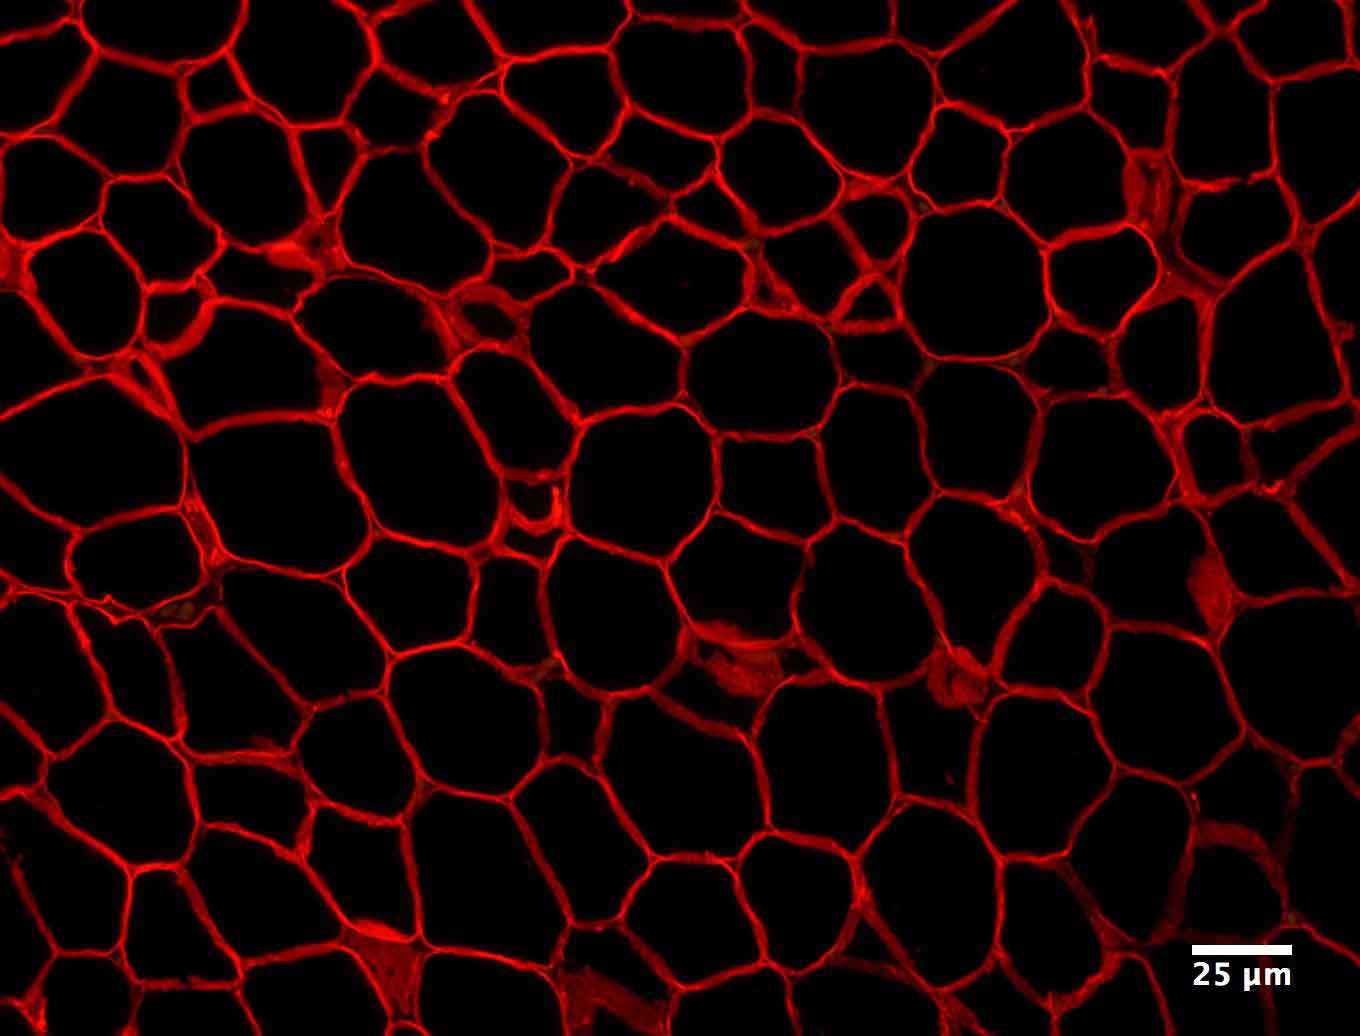

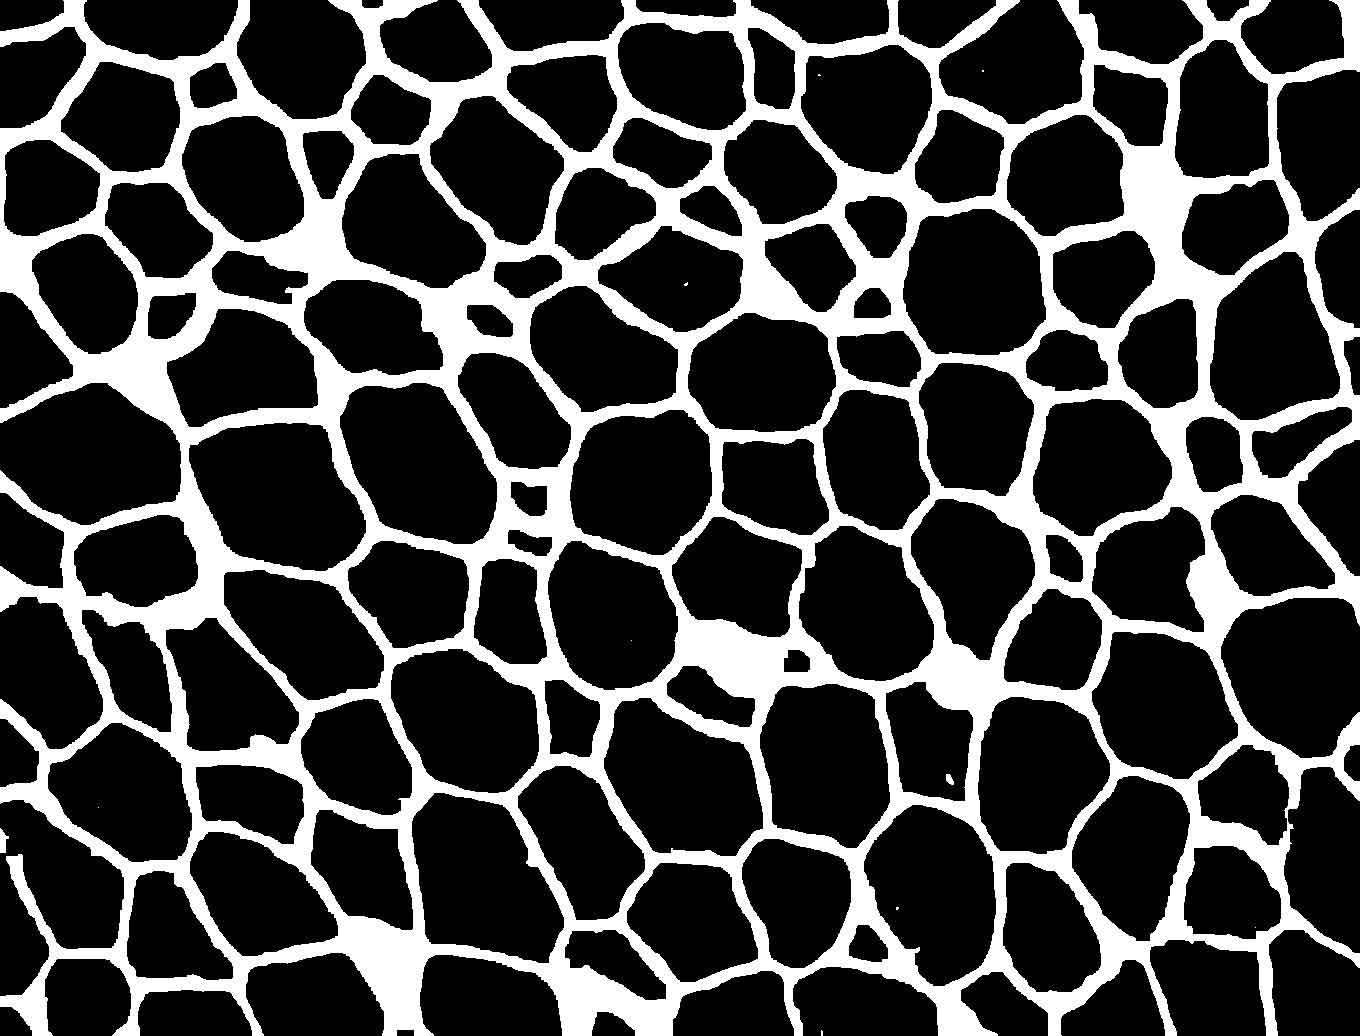
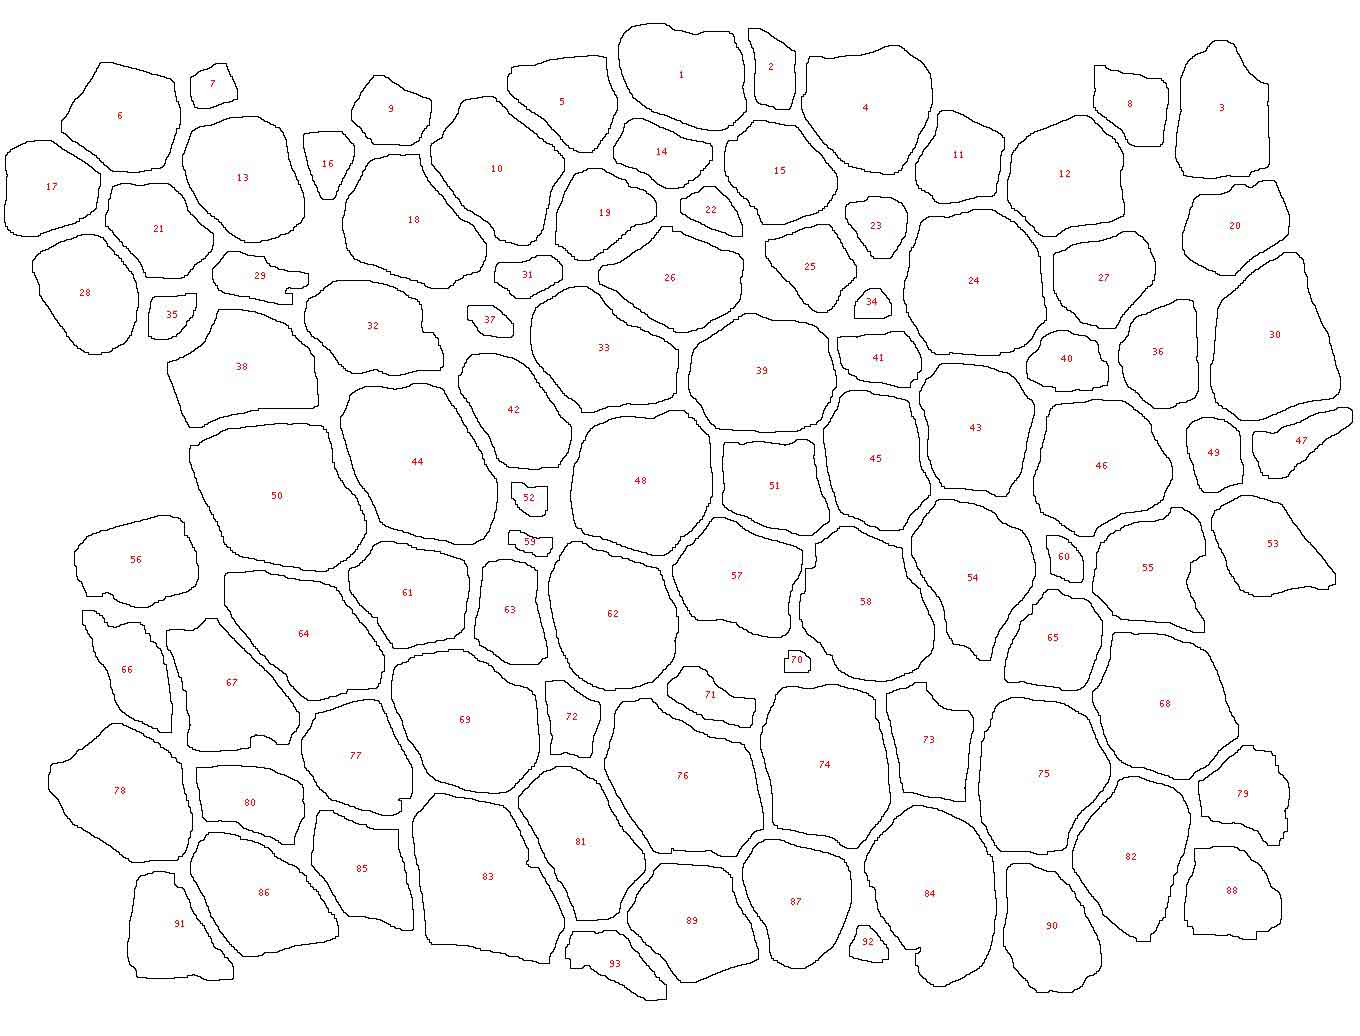
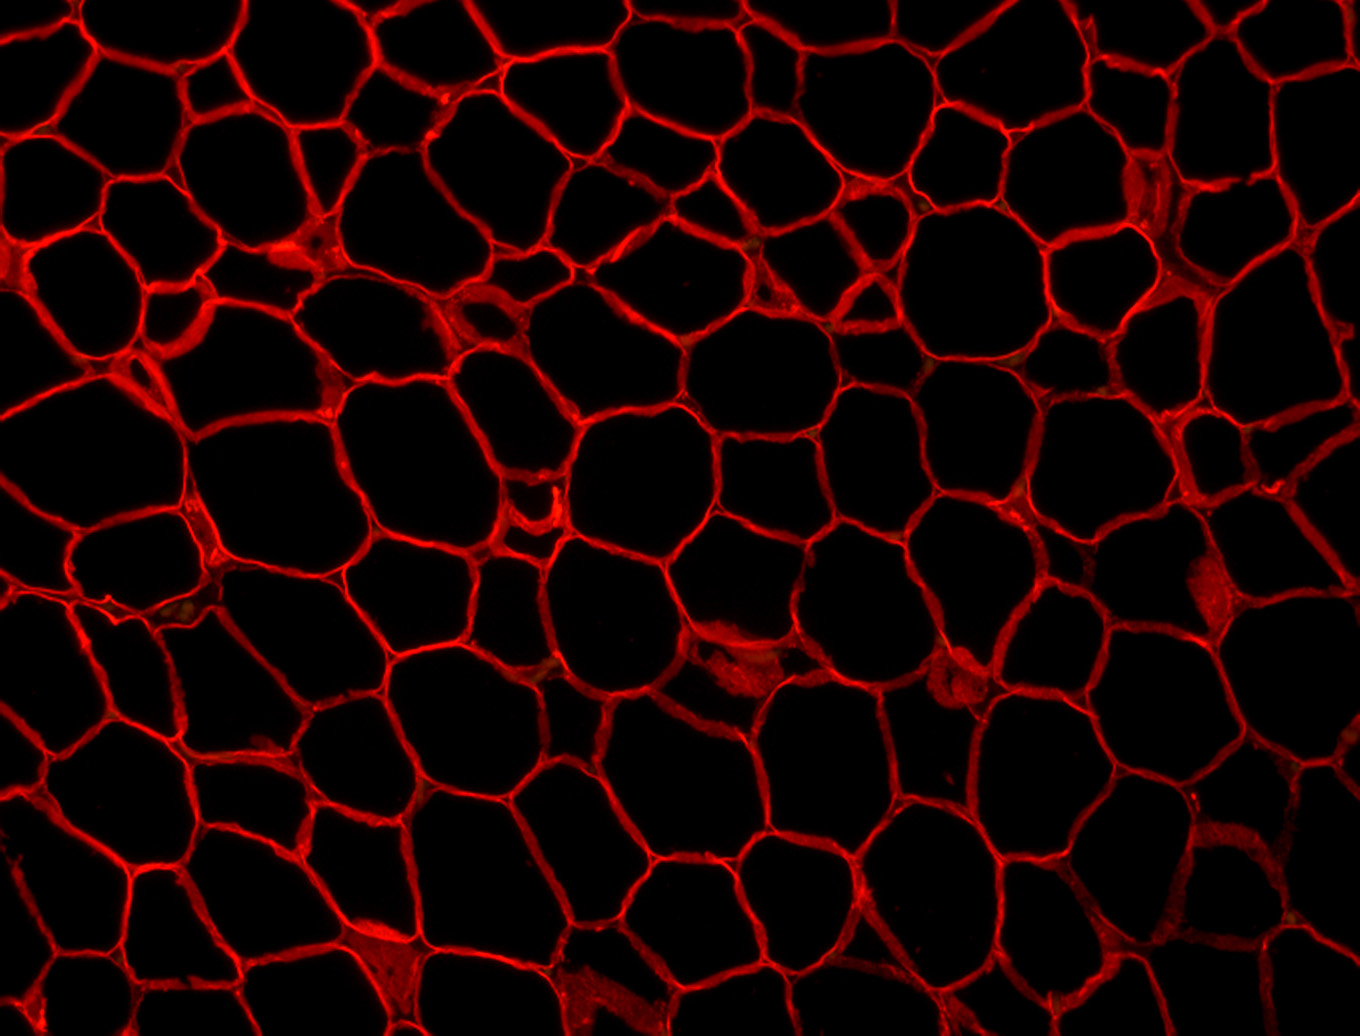
Figure 1. Example image at each step of the analysis. (1) The original image showing a slice of mouse fat tissue stained for Perilipin A. The scale bar has been added to the original; scale bars should not be used in the actual image for analysis. (2) The image after thresholding with macro 1. (3) the image after manual correction. (4) The image after lipid droplet quantification with macro 2. Note that one manual correction is made - the filling in of a false “droplet” created by a torn membrane in the center of the image.
Protocol
I suggest testing this protocol on the image below. Once it is working for you, adjust the parameters in each macro (ie. scale, threshold) to match your own images.
Set up the file system
- Make a “LD_analysis” folder
- Make the following other folders in the LD_analysis folder: Original Images, Thresholded Images, Corrected Images, Droplet Outlines
- Place the original images in LD_analysis > Original Images
Run the macro “DropletAreaPart1.ijm”
- Open ImageJ.
- Open any image.
- Use the upper menu to access Plugins > Macros > Edit. Open the “DropletAreaPart1.ijm” macro. Adjust the scale and thresholding parameters to match your images
If this is the first time you are using this macro, access Plugins > Macros > Record to make a new macro. For more detailed instructions, see the ImageJ Basics page.
- Run the macro (Macros > Run). Note: You must click on the macro editor window in order for the Macro menu to appear.
- When the macro starts, two dialog boxes will open asking you to choose a folder. For the first folder, select “Original Images.” For the second folder, select “Thresholded Images.”
Macro: DropletAreaPart1.ijm
  run("Set Scale...", "distance=4 known=1 pixel=1 unit=um global");
  run("Set Measurements...", "area display redirect=None decimal=2");
  dirInput = getDirectory("Choose  Directory ");
  dirOutput = getDirectory("Choose  Directory ");
  list = getFileList(dirInput);
  setBatchMode(true);
  for (i=0;i<list.length;i++) {
    open(dirInput+ list[i]);
    run("8-bit");
    setAutoThreshold("Huang");
    run("Convert to Mask");
    run("Options...", "iterations=5 count=1 pad edm=8-bit do=Open");
    saveAs("Jpeg", dirOutput + File.nameWithoutExtension + "_Threshold");
    close();
  }
Manually draw in broken borders between lipid droplets
- Open a thresholded image and its corresponding original image in ImageJ. Check for instances where there are errors in thresholding (see figure 1 for examples).
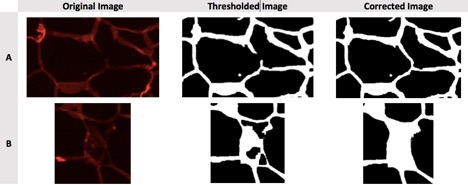
Figure 2. Examples of problems to correct manually. A) Torn membrane separating two lipid droplets should be joined with a line. B) A large, torn section of membrane is obscuring a lipid droplet, causing it to be detected as multiple small lipid droplets; the false “droplets” should be filled in.
- Double click the paintbrush tool and select brush width “10” and color “white” a. Brush width should approximately match the width of the lipid droplet membranes in the thresholded image
- Use the paintbrush tool to draw in borders between lipid droplets, referencing the original image to determine whether there should be a border
- Use the paintbrush tool to fill in areas that should not be counted as lipid droplets
- Save the image to the “Corrected Images” folder
Run the macro “DropletAreaPart2.ijm”
- Open the .Open the “DropletAreaPart2.ijm” macro for editing (Plugins > Macros > Edit). Adjust the scale and thresholding parameters to match your images
- Run the macro (Macros > Run)
- When the macro starts, two dialog boxes will open asking you to choose a folder. For the first folder, select “Corrected Images.” For the second folder, select “Droplet Outlines.”
Macro: DropletAreaPart2.ijm
run("Set Scale...", "distance=4 known=1 pixel=1 unit=um global");
run("Set Measurements...", "area display redirect=None decimal=2");
dirInput = getDirectory("Choose  Directory ");
dirOutput = getDirectory("Choose  Directory ");
list = getFileList(dirInput);
setBatchMode(true);
for (i=0;i&altlist.length;i++) {
  open(dirInput+ list[i]);
  setAutoThreshold("Huang");
  run("Convert to Mask");
  run("Analyze Particles...", "size=3-8000 circularity=0.30-1.00 show=Outlines display exclude summarize");
  saveAs("Jpeg", dirOutput + File.nameWithoutExtension + "_DropletArea");
  close();
  }
Manually check the outlined images for errors
- Compare the outlined droplets to the original photos. If an error is found, manually draw in broken borders on the “Corrected Images” as before. When finished, delete all “Droplet Outlines” and rerun the part 2 macro.
Save the results
When “DropletAreaPart2.ijm” is run, two pop-up windows appear. Copy/Paste the data relevent to you to a spreadsheet in a different program (ex. Excell).
Note: The Summary window gives the total number of droplets counted and their average size. The Results window gives the area of each droplet individually.
Data from our example image There are 93 lipid droplets counted in the [manually corrected] example image. The droplets have an average area of 543.6um^2, which corresponds to an average diameter of 25um.
Background notes and limitations of the protocol
- In white fat tissue, a single lipid droplet usually dominates intracellular area so that "lipid droplet area" and "cellular area" are synonymous. In brown fat, the term "lipid droplet area" more precisely describes the area quantified because there are multiple detectable lipid droplets per cell.
- In literature, lipid droplet diameter is more commonly reported than area. Diameter has the added advantage that it is easily checked by eye in images with a scale bar. To extrapolate from area to diameter, use the formula for the diameter of the corresponding circle: d = 2*sqrt(A/pi), where d = diameter and A = area
- Fat cells are spherical, but the images of fat tissue quantified in this protocol are two-dimensional. The area measured by this protocol can be used to extrapolate from diameter to lipid droplet volume, but under the (false) assumption that each lipid droplet in an image has been sliced through its centroid. See [Lemonnier et al.] for a detailed examination of volume extrapolation.
- Macro 2 does not quantify lipid droplets that extend outside the borders of the image. The reason: the area of the missing portion of the lipid droplet cannot be quantified. This protocol could be modified to count the number of lipid droplets per image (a common measurement reported in literature), in which case the droplets on the edge could be counted by removing the "exclude" parameter from the "Analyze Particles" function in macro 2.