PROTOCOL: RNA quantification with qPCR
Purpose
- To design and analyze qPCR experiments in such a way that the results are repeatable and publishable
- To account for differences in amplification efficiencies between TaqMan probes
Background
See the Real-time PCR handbook by LifeTechnologies or BIO-RAD Real-Time PCR Applications Guide (2006)
Materials
- StepOne machine and software
- RNA isolation kit, ex. . QIAshredder + Qiagen RNeasy kit
- Reverse transcription kit (ex. qScript cDNA Synthesis kit, Quanta 95047)
- Control probe, ex. beta-actin
- Experimental probe
- Experimental sample, ex. cells
RNA preparation + qPCR
- Perform RNA isolation (ex. QIAshredder + Qiagen RNeasy kit)
- Perform reverse transcription (ex. qScript cDNA Synthesis kit, Quanta 95047)
- Run a qPCR standard curve. Analyze it (see analysis methods below). If the reaction is determined to be sub-optimal, troubleshoot until it is optimal
- Perform qPCR for the samples. a. Each plate with samples on it must have a standard curve on the same plate. Use the amplification efficiency calculated from the standard curve on the same plate for analysis. This way, results from samples from different plates can be combined.
Notes on required wells in the qPCR plate
First run for a new probe
- Standard curve for each probe: The standard curve must encompass the entire Ct range for all samples tested. Therefore, the standard curve sample should come from the tissue with the highest gene expression (ie. colon for Cftr expression). If samples will fall across a large range of the standard curve and the standard curve is not linear across this range, a second standard curve sample from a tissue with lower gene expression may be needed. Dilute the standard curve sample into RNase-free water in a 1:2 - 1:10 dilution series composed of at least 5 dilutions. See section 1.1.3 on pages 4-6 of the BIO-RAD Real-Time PCR Applications Guide (2006) for an overview of qPCR standard curves
- Control sample to test for contamination with genomic DNA: –RT (all components of reverse transcription except reverse transcriptase) or 100ng total RNA alone. Run one control per probe using the standard curve sample with the highest concentration
Subsequent runs
- Samples in duplicate or triplicate
- Control to test for contamination with genomic DNA: –RT (all components of reverse transcription except reverse transcriptase) or 100ng total RNA alone. Run a control for every sample.
- Standard curve for each probe (see above)
qPCR analysis
- Open the results file in StepOne software
- Set the amplification plot type to “Rn vs. Cycle” (linear y-axis)
- Manually set the range of cycles for baseline calculation manually for both the housekeeping probe (ex. actin) and the experimental probe. The baseline should be in the linear non-increasing part of the curve for all samples. A typical baseline ranges from cycles 3-15.
- Set the amplification plot type to “Delta Rn vs. Cycle” (linear y-axis)
- Manually set the threshold for both Cftr and actin. The threshold should be in the linear, exponentially increasing part of the curve for all samples; just above the lowest number at which this is possible. a. It is important to set the threshold from the Delta Rn vs. Cycle view
- Export the results. In the export window, customize the report to include only the following fields: well, sample name, target, baseline, CT, and CT threshold a. Note: Cycle threshold (CT) will be abbreviated as Ct hereafter
qPCR standard curve
Optimized qPCR assays are characterized by:
-
A linear standard curve (R2 > 0.980 or r > –0.990 ) - High amplification efficiency (90–105%)
- Consistency across replicate reactions
- Plot the logd(dilution factor) against Ct value, where d = the dilution factor for the dilution series (ex. 10 for the 1:10 series or 2 for the 1:2 series). Calculate the linear regression line (y=mx+b) and its coefficient of determination (R2). For example, see Figure 1
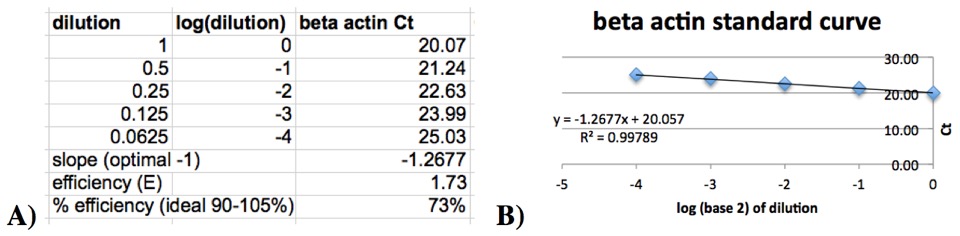
Figure 1: Example standard curve data table (A) and graph (B)
- Calculate the following: Amplification efficiency, E, is: E = d^(–1/slope) Percent efficiency is: (E – 1) x 100%
Ideally, the amount of PCR product doubles during each cycle of exponential amplification. Quality of the probe determines percent efficiency. The linearity (R2) is determined by the pipetting accuracy for the serial dilution of the standard curve.
qPCR sample analysis protocol
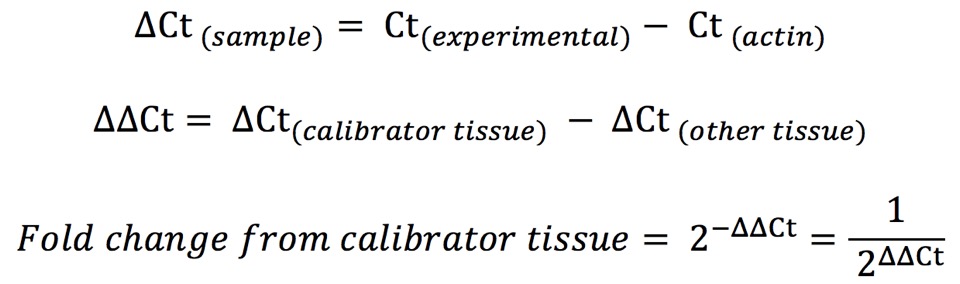
If the amplification efficiencies for the housekeeping probe (ex. actin) and the experimental probe are 90–105%, analyze the data with the 2-ΔΔCt (Livak) Method (as specified in section 4.2.3.1 on page 43 of the BIO-RAD Real-Time PCR Applications Guide (2006). Briefly…
If the amplification efficiencies for actin and Cftr are different and outside the range 90–105%, analyze the data with the Pfaffl method (as specified in section 4.2.3.3 on page 43 of the BIO-RAD Real-Time PCR Applications Guide (2006)).
[optional] Check qPCR results with endpoint PCR
- Using cDNA generated for qPCR, PCR amplify the samples with regular PCR primers (not TaqMan)
- Image the results on a DNA gel
If some samples show signal using endpoint PCR but not qPCR
- PCR amplify cDNA with primer pairs that nest the TaqMan probes
- Perform qPCR for the samples
Issues with pre-amplification
- This is not quantitatively comparable to the other samples unless all samples are run like this. Or unless a normalizer sample is also run with this method
- PCR reaction mixture may interfere with qPCR. To test this, run a standard curve. If the standard curve is poor, try running the PCR product on a gel and then isolating the product from the gel with the QIAquick Gel Extraction Kit prior to qPCR
Tip
- Actin and Cftr TaqMan probes interfere with each other. Both their amplification efficiencies are improved by running the probes in separate wells.